こちらのツイートを見かけたのでPythonで早速実行してみました。
ひっぺんさんはPythonと株を掛け合わせて様々な記事を書かれており大変参考になりそうな情報を提供してくれている方です。

たろ
株の勉強とPythonの軽いジャブ打ちができればな〜と。
環境の準備
必要なライブラリは以下の通り。
import yahoo_fin.stock_info as si
import fix_yahoo_finance as yf
import pandas as pd
from datetime import datetime as dt
import datetime
from matplotlib import dates
import matplotlib.pyplot as plt
%matplotlib inline
Anacondaで環境を作っているため、必要なパッケージは yahoo_fin だけでした。
以下のコマンドを実行して準備完了です。
pip install yahoo_finわたしの環境ではこれだけだとエラーになってしまったので、追加でコマンドを実行しました。
詳しくは下記の記事で書いています。
参考:ModuleNotFoundError: No module named ‘fix_yahoo_finance’ が出たときの対処法

たろ
下準備ができたので早速やっていきましょ〜
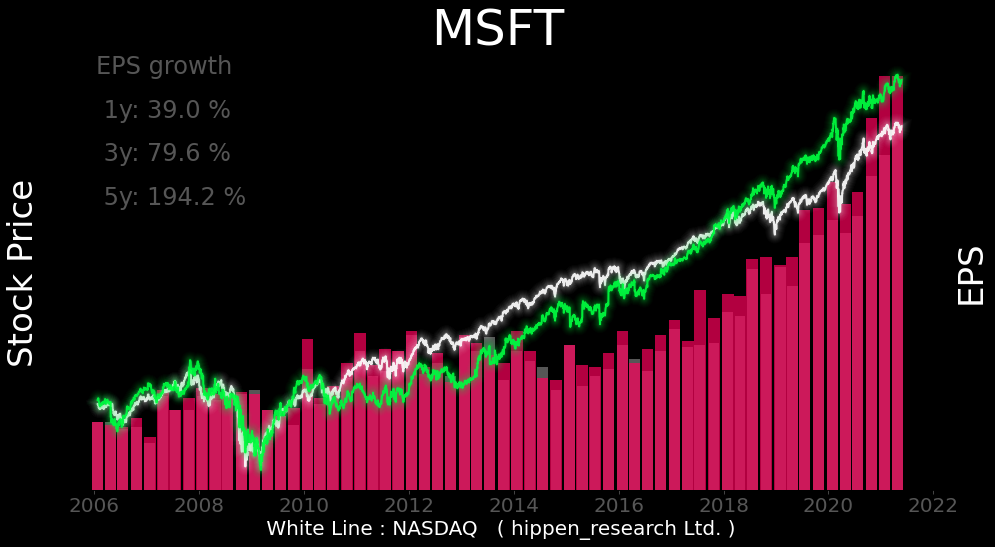
成果物のイメージ

- 緑色:対象銘柄の株価
- 白色:NASDAQ
- 赤色:実績EPS
- 灰色:予想EPS
・左上にはEPSの成長率(1年、3年、5年)を表示しています。
【Python】EPSと株価を重ねて確認!
・棒グラフは、実績EPS(赤色)と予想EPS(灰色)を重ねて表示しています。つまり、灰色が見えている部分は、決算が予想を下回った幅を示しています。逆に、赤色が濃くなっている部分は、予想を上回った幅を示しています。
実行コード
#! pip install yahoo_fin
import yahoo_fin.stock_info as si
import fix_yahoo_finance as yf
import pandas as pd
from datetime import datetime as dt
import datetime
from matplotlib import dates
import matplotlib.pyplot as plt
%matplotlib inline

plt.close()

# データ取得期間設定
start_tmp = '2006-1-01'
end_tmp = datetime.date.today().strftime("%Y-%m-%d")

# 銘柄の指定
codelist = ['MSFT']

# EPS情報の取得
ticker=codelist[0]
ticker_earnings_hist = si.get_earnings_history(ticker)

# EPSグラフ作成のためのデータ調整
df =pd.DataFrame.from_dict(ticker_earnings_hist).loc[:,["startdatetime","epsestimate","epsactual"]]
df.rename(columns={'epsestimate':'EPS_Estimate','epsactual':'EPS_Actual','startdatetime':'Date'},inplace=True)
df['Date'] = pd.to_datetime(df["Date"], format='%Y-%m-%d')
df = df.sort_index(axis='index',ascending=False)[["Date","EPS_Estimate", "EPS_Actual"]]
# 期間調整
df2=df[(df['Date'] > start_tmp) &(df['Date'] < end_tmp)]
fig, ax1 = plt.subplots(figsize=(16,8))
fig.patch.set_facecolor('black')

# EPSグラフと株価の軸を結合
ax2 = ax1.twinx()

# EPSグラフ作成 予想と結果を重ねて表示
ax2.bar(df2.Date, df2.EPS_Estimate,width=75,color='#565656',alpha=1.0)
ax2.bar(df2.Date, df2.EPS_Actual,width=80,color='#ff005c',alpha=0.7)

# EPSデータと株価取得日の範囲調整
start = df2.iloc[0,0]
end = end_tmp

# 比較対象の株価データ取得
data_ind = yf.download("QQQ", start=start, end=end)["Adj Close"]
data_ind2=(1+data_ind.pct_change()).cumprod()

# グラフ作成と光沢感を出す繰り返し処理
ax1.plot(data_ind2,color="white",alpha=0.9,linewidth=2)
for n in range(1,10):
 ax1.plot(data_ind2,linewidth=(2*n),alpha=0.2/(1*n),color="white")

# メインの株価データ取得
data_stk = yf.download(ticker, start=start, end=end)["Adj Close"]
data_stk2=(1+data_stk.pct_change()).cumprod()

# グラフ作成と光沢感を出す繰り返し処理
ax1.plot(data_stk2,color="#00ff41",alpha=0.9,linewidth=2)
for n in range(1,10):
 ax1.plot(data_stk2,linewidth=(2*n),alpha=0.2/(1*n),color="#00ff41")

# EPS成長率の計算
growth_01=(round(df2.EPS_Actual.pct_change(3).iloc[-1]*100,1))
growth_03=(round(df2.EPS_Actual.pct_change(11).iloc[-1]*100,1))
growth_05=(round(df2.EPS_Actual.pct_change(19).iloc[-1]*100,1))

# EPS成長率をグラフに書き込み
ax1.text(0.05, 1.0, "EPS growth" ,horizontalalignment='left', verticalalignment='top',transform=ax1.transAxes, fontsize=24,color="#565656")
ax1.text(0.05, 0.9, " 1y: "+str(growth_01)+" %" ,horizontalalignment='left', verticalalignment='top',transform=ax1.transAxes, fontsize=24,color="#565656")
ax1.text(0.05, 0.8, " 3y: "+str(growth_03)+" %" ,horizontalalignment='left', verticalalignment='top',transform=ax1.transAxes, fontsize=24,color="#565656")
ax1.text(0.05, 0.7, " 5y: "+str(growth_05)+" %" ,horizontalalignment='left', verticalalignment='top',transform=ax1.transAxes, fontsize=24,color="#565656")

# グラフ関連処理
plt.title(ticker, color="white",fontsize=50)
ax1.set_xlabel(' White Line : NASDAQ   ( hippen_research Ltd. )',fontsize=20,color="white")
ax1.set_ylabel('Stock Price', fontsize=34,color="white")
ax2.set_ylabel('EPS', fontsize=34,color="white")
ax1.set_yscale("log")
ax1.set_zorder(2)
ax2.set_zorder(1)
ax1.patch.set_alpha(0)
ax1.grid(False)
ax1.tick_params(axis='x', colors='#565656',labelsize=20)
ax1.axes.yaxis.set_ticklabels([])
ax2.axes.yaxis.set_ticklabels([])
plt.xlabel(xlabel="")
plt.show()
plt.close()

# ここまで
感想
- APIで株価情報などが取得できる点は使い勝手満点
- グラフがおしゃれすぎて読解が大変そう
- EPSなど株についての知識が皆無すぎてグラフの見方がさっぱり

たろ
Pythonと組み合わせて楽しみながら株の勉強をしていくきっかけができました


